The numbers coming out of Venezuela right now don't make sense at first glance. On one hand, you have the Venezuelan government stating that 855 buildings suffered damage after the massive twin earthquakes hit on June 24. On the other hand, NASA released a preliminary analysis showing that nearly 59,000 structures are likely damaged or completely ruined.
That is not a minor gap. That is a completely different story.
When a disaster of this scale hits, getting accurate data fast is a matter of life and death. The twin quakes measured 7.2 and 7.5 in magnitude, striking just 40 seconds apart near San Felipe. It is the most violent seismic event the country has experienced in over a century. With the death toll already past 1,700 and tens of thousands of people displaced, understanding the true physical footprint of the destruction changes how rescue teams deploy.
If you look closely at how the data is gathered, the massive discrepancy between the official state numbers and the satellite data makes perfect sense. It reveals a lot about how modern disaster response actually works when the ground infrastructure completely fails.
The Massive Gap Between Ground Reports and Space Imagery
Why is the official count so low compared to what the satellites see? The answer is simple. Ground teams can only count what they can physically reach and see with their own eyes.
When National Assembly President Jorge Rodríguez reported 855 damaged buildings and 189 total collapses, he was sharing verified, ground-level assessments. Those numbers are real, but they represent a tiny fraction of the disaster zone. Right now, coastal areas like La Guaira state are completely cut off. Roads are blocked by massive landslides. Bridges have buckled. Communication lines are down, and local cell towers are completely dark.
If a rescue team cannot drive into a neighborhood, they cannot count the broken homes.
Satellites do not have that limitation. Researchers Corey Scher and Jamon Van Den Hoek from Oregon State University didn't wait for the roads to clear. They used radar data from the European Space Agency's Sentinel-1 satellite, processed through NASA's Disaster Response Coordination System, to scan the entire region from orbit just one day after the disaster.
Their system flagged approximately 58,870 structures showing sudden, drastic physical changes. The satellite looks at the entire picture all at once, ignoring political boundaries, blocked roads, and bureaucratic delays. It gives an immediate, brutal look at the true scale of the crisis.
How Radar Sees Through the Chaos
Most people think satellite damage assessment means looking at pretty pictures of ruined buildings from space. It doesn't. Relying on standard optical photography during a tropical disaster is a terrible strategy because clouds, smoke, and dust completely block the view.
Instead, scientists use Synthetic Aperture Radar, or SAR.
SAR satellites send down radar pulses that bounce off the ground and return to the spacecraft. The instrument measures both the time it takes for the pulse to return and the strength of the reflected signal. Because radar waves pass right through clouds and can operate in total darkness, they can map a disaster zone at 6 PM local time, right when these earthquakes struck.
The process relies on a technique called coherence loss or abrupt surface change detection. I will break down how it works without the academic jargon.
- The Baseline Scan: The satellite maps the urban areas weeks or days before the disaster. It knows exactly how a stable concrete building reflects radar waves back to orbit.
- The Post-Event Scan: The satellite flies over the exact same path after the earthquake and sends down another radar pulse.
- The Comparison: If a building is perfectly fine, the radar reflection stays identical. If the building has cracked, shifted, tilted, or pancaked into a pile of rubble, the geometric structure changes completely. The radar wave bounces off at a bizarre angle, or the reflection drops in intensity.
The software flags these differences as a damage proxy map. When the Oregon State researchers reported 58,870 impacted buildings, they were identifying 58,870 distinct points where the ground surface changed abruptly between June 24 and June 25.
It is a rapid assessment tool. It is not perfect, and the researchers are transparent about that. It can mistake a collapsed retaining wall or a massive pile of shifted soil for a ruined house. But when you need to know where to send thousands of international rescue workers, this map is the only tool that gives you immediate answers.
The Reality in the Hardest Hit Zones
If you want to know where those 58,000 buildings are, look at the coastline. The coastal cities of Caraballeda, Macuto, Playa Grande, and Puerto Viejo are facing an apocalyptic situation.
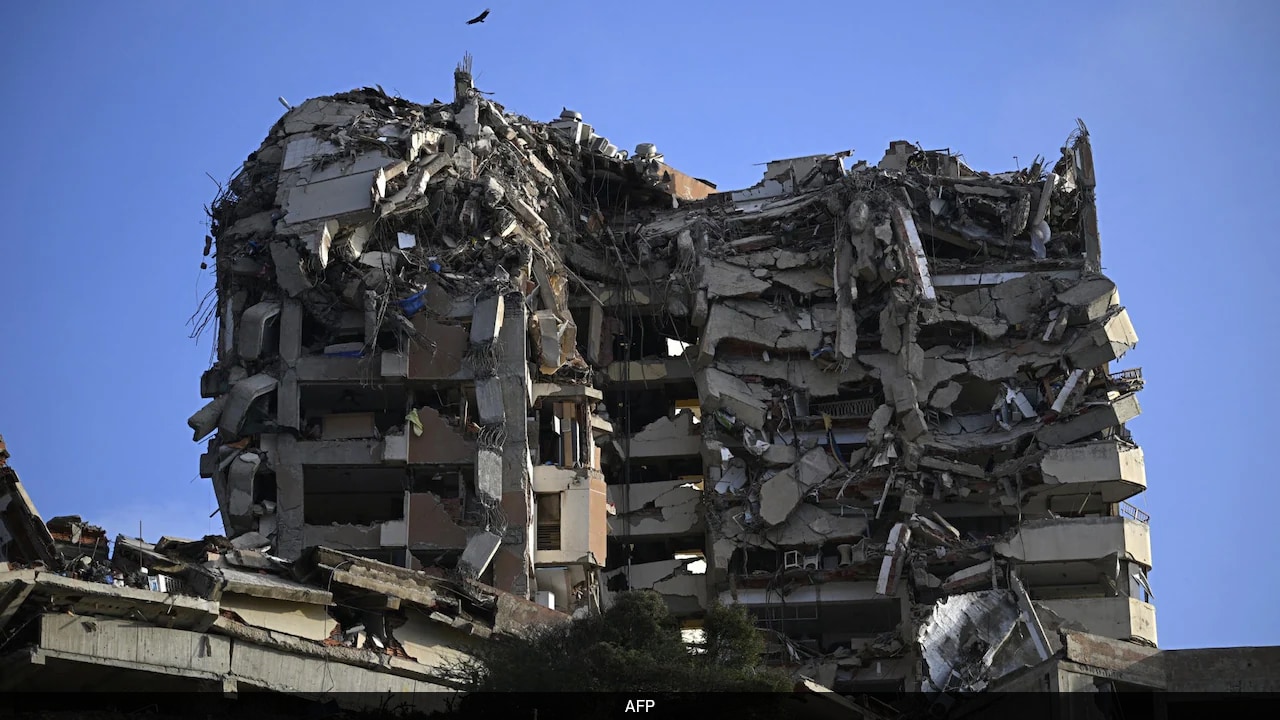
Caraballeda, which houses around 53,000 residents along the Caribbean coast, sits directly in the crosshairs of this destruction. Before-and-after imagery shows that whole blocks of seafront high-rises and resorts have just slid out of their footprints or dropped flat. The density of the built environment in these areas explains why the numbers climbed so high so fast.
Local political activist Jesús Armas highlighted a major issue from Caracas that structural engineers have feared for years. The structural insecurity of these buildings was incredibly high before the first shockwave even hit. Many of the hardest-hit structures were either informal homes crammed into steep working-class hillsides or massive, poorly reinforced housing projects built rapidly by the state without proper seismic buffering.
When you hit vulnerable infrastructure with a 7.2 magnitude shock, followed 40 seconds later by a 7.5 magnitude strike, the buildings don't just crack. They disintegrate.
The second quake is what did the real damage. A building weakened by the first tremor loses its structural elasticity. When the second wave hits less than a minute later, the columns fail instantly. That is why we are seeing total neighborhood collapses in places like Macuto.
Why This Orbit Data Dictates the Relief Effort
Some critics argue that using unverified satellite data causes unnecessary panic. They say we should stick to verified ground truths. That view is incredibly dangerous in real-world emergency management.
Waiting for perfect ground verification means people die under the rubble.
The first 72 hours are the golden window for saving lives. After that, dehydration, severe crush injuries, and suffocation take over. The satellite data acts as a giant triage tool for the 1,600 foreign rescuers who just arrived from countries like Türkiye and various international aid agencies.
Instead of sending search teams randomly into the state of La Guaira, commanders look at the NASA damage maps. They can see that Puerto Viejo has a massive cluster of high-intensity surface changes, while another inland town might look relatively stable. They use this data to route helicopters, identify open fields that are safe for landing humanitarian aid, and deploy heavy lifting equipment where the most collapsed buildings are clustered.
UNICEF recently reported that over 680,000 children need immediate humanitarian aid in the wake of these quakes. They lack clean water, shelter, and medical care. The satellite data helps logistics experts map out safe supply corridors, showing which bridges are likely dropped so trucks don't get trapped on dead-end highways.
What Needs to Happen Next
The immediate rescue phase is wrapping up, and the focus is shifting to long-term survival and rebuilding. If you are tracking this crisis or trying to figure out how to help, the data points to clear next steps for the international community and emergency managers.
First, ground teams must correlate the satellite damage proxy maps with real-world inspections. This means using the orbital map as a checklist to systematically clear neighborhoods and locate missing people.
Second, the international community needs to focus heavily on logistics. Because the satellite images show extensive damage to transport infrastructure, getting supplies through ports and temporary airfields near La Guaira is the priority. Standard overland shipping will not work for the next few weeks.
Finally, this disaster proves that satellite-based radar monitoring should be a standard, automated feature for every major fault line on earth. We cannot rely on spotty local communication when the earth tears itself apart. The eye in the sky saw what the ground teams couldn't, and those orbital radar pulses are the only reason we know the true scale of what Venezuela is facing right now.